How to detect GPS jamming: a free, reproducible method
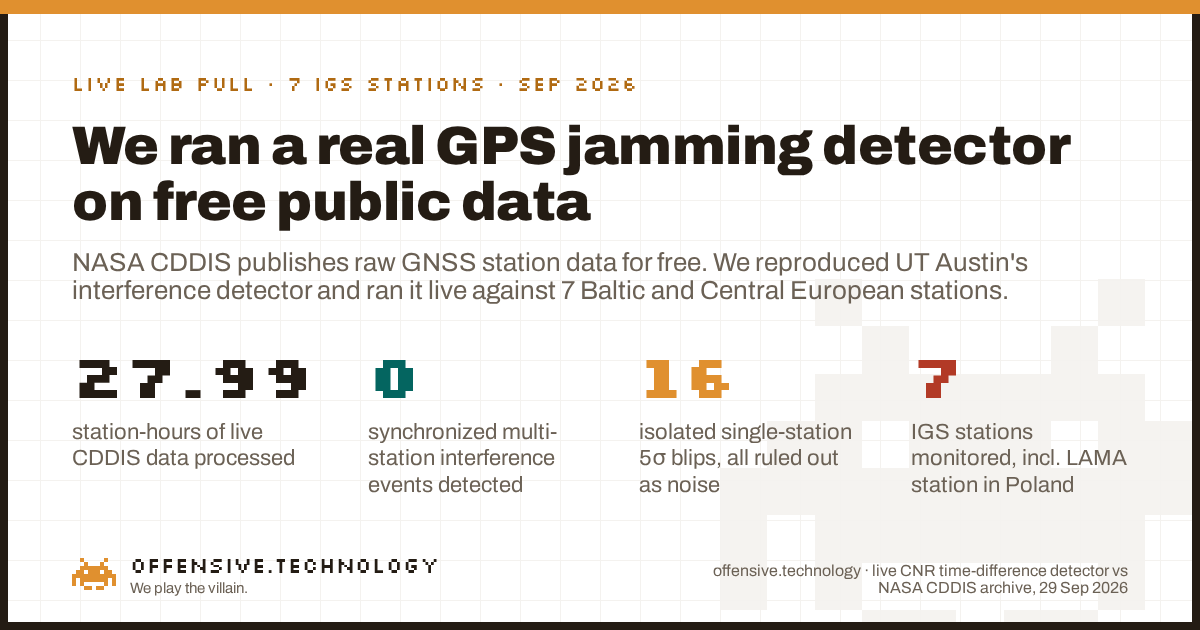
Short answer: you do not need proprietary hardware or a classified feed. Most GNSS receivers already compute carrier-to-noise ratio (CNR, also written C/N0), a number describing how cleanly they are hearing each satellite, and NASA's CDDIS archive publishes that value for free from over 500 public IGS ground stations worldwide, updated within minutes. A 2025 University of Texas at Austin method (Clements & Humphreys) mines that same free archive to catch real GPS interference: difference each satellite's CNR against itself a few seconds earlier, average across every satellite a station tracks, and watch for a synchronized spike at multiple stations hundreds of kilometers apart at the same moment. A spike at one station alone, with no echo anywhere else, is noise, not jamming. We built this detector and ran it live against 27.99 station-hours of real CDDIS data across 7 stations in the Baltic and Central Europe, including LAMA in Poland. Our window was quiet: 16 isolated single-station anomalies, zero synchronized multi-station events. Below is the full method, the real data, and what separates a genuine detection from a coincidence.
Why this matters now
GPS and GNSS interference in the Baltic Sea region has gone from a niche electronic-warfare topic to mainstream news. Aviation and maritime authorities in Poland, Lithuania, and Finland have reported a sharp rise in jamming and spoofing since 2022, and outlets from Defense News to Euronews have covered phones, drones, and ships losing GPS fix across the region through 2026. Pilots track it daily on community boards like OPSGROUP; a public heatmap, gpsjam.org, aggregates aircraft ADS-B navigation-accuracy reports into a live map. That is a genuinely useful operational tool, but it infers interference indirectly, from how aircraft behave. It does not read the receiver's actual signal quality.
Search for "how to detect GPS jamming" today and the results are almost entirely fleet-tracker vendors selling hardware, with generic "signs to watch for" listicles attached. None of them show you a real detection pipeline running against real data. That is the gap this post fills: a signal-layer method, built on data anyone can download for free, with the code and the real numbers shown rather than asserted.
The method: time-differenced carrier-to-noise ratio
Carrier-to-noise ratio describes how strongly a receiver hears a given satellite's signal relative to the background noise floor, in dB-Hz. It varies naturally with satellite elevation, antenna quality, and atmospheric conditions, which makes a raw CNR threshold a poor jamming detector: a low satellite near the horizon looks similar to a jammed one. The fix used by Clements and Humphreys is to threshold the short-lag time difference instead, which cancels out slow, natural drift and isolates fast transients:
- Per-satellite difference. For each tracked satellite, compute ε[k] = CNR[k] − CNR[k−L], with L around 3 seconds at a 1 Hz sample rate.
- Station statistic. Average ε[k] across every satellite the station currently tracks, to get a single per-station value Λ[k] at each epoch.
- The null. On a quiet day, Λ[k] behaves like zero-mean noise with a station-specific width, set by that station's own receiver and antenna. Fit that width empirically and set a threshold some number of standard deviations above it.
- The real discriminator: space, not just amplitude. A genuine wide-area interference source, a satellite leaking RF or a powerful ground emitter, hits multiple, geographically dispersed stations within the same few-second window. A threshold crossing confined to one station, with no echo at any other station hundreds of kilometers away, is far more likely local: multipath, a physical obstruction, a receiver hiccup, or ionospheric scintillation, which every paper we read flags as the main false-positive risk.
What we actually ran
A skeptic should be able to rebuild this, so here is the whole pipeline.
- Stations. Seven IGS high-rate stations spread roughly 2,000 km across Central and Northern Europe: LAMA (Lamkówko, Poland), GANP (Ganovce, Slovakia), GOPE (Pecny, Czechia), MAR6 (Mårtsbo, Sweden), METG (Metsähovi, Finland), ONSA (Onsala, Sweden), and WTZR (Wettzell, Germany). LAMA was chosen because the cited paper's own follow-on work reports its largest recorded CNR drops there.
- Window. 2026-09-29, a Tuesday, 07:00 to 11:00 UTC, the most recent complete weekday with high-rate data available at run time. Business hours were chosen because the cited paper found interference clustering there.
- The pull. NASA CDDIS's high-rate RINEX v3 archive is organized in 15-minute blocks. HTTPS access returned a flat 401: Earthdata login is now mandatory there, confirming a June 2025 access change. Anonymous FTP-SSL worked with zero authentication, the same access CDDIS has offered for years:
ftp://gdc.cddis.eosdis.nasa.gov/gnss/data/highrate/<yyyy>/<ddd>/<yy>d/<HH>/. 112 fifteen-minute files, 104 MB total, across the 7 stations and 4 hours. - The parse. Files are Hatanaka-compressed RINEX v3. We decompressed and parsed with the open-source
georinexandhatanakaPython libraries, extracting the GPS L1 C/A carrier-to-noise field (S1C) per satellite per epoch. - The math. Exactly the Λ[k] statistic above, L = 3 seconds, evaluated at two thresholds, 5σ and 6σ, against each station's own empirical noise floor. A crossing counts as a candidate multi-station event only if it occurs at more than one station within a 5-second window.
- What we did not do. We requested nothing from any host but NASA's own public archive, transmitted no RF, and collected no personal data. Station coordinates and equipment metadata are public IGS infrastructure records, not private information.
What 27.99 quiet station-hours actually look like
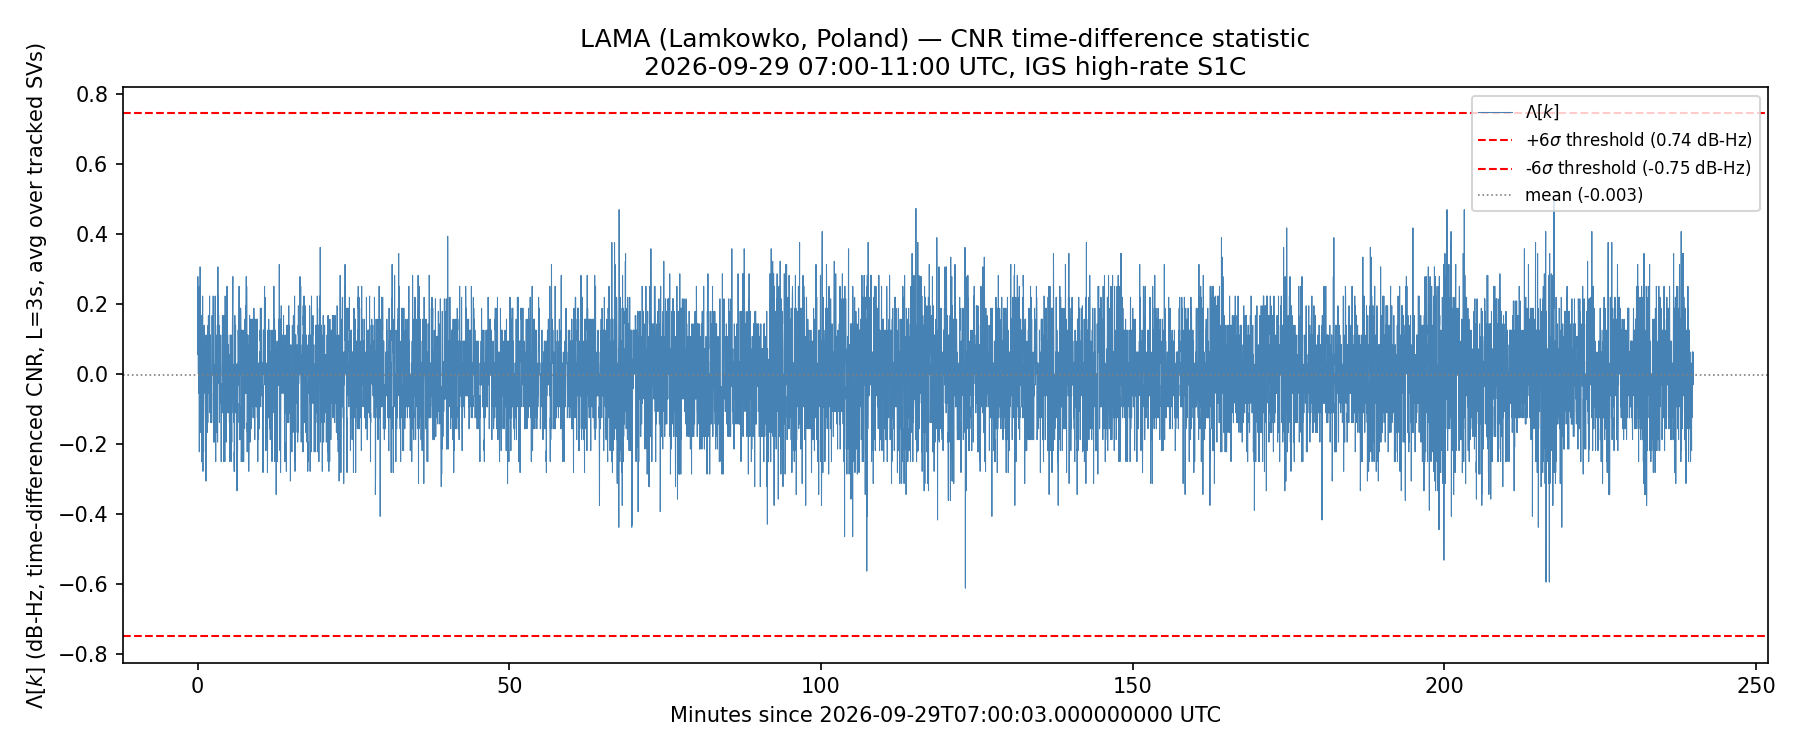
LAMA, our headline station, was the calmest of the seven. Its Λ[k] noise floor measured just 0.124 dB-Hz standard deviation, and it produced zero threshold crossings at either 5σ or 6σ across the full four-hour window. This is what a genuinely clean signal looks like, not a flat line, real noise bouncing within a well-behaved band, never once stepping outside it.
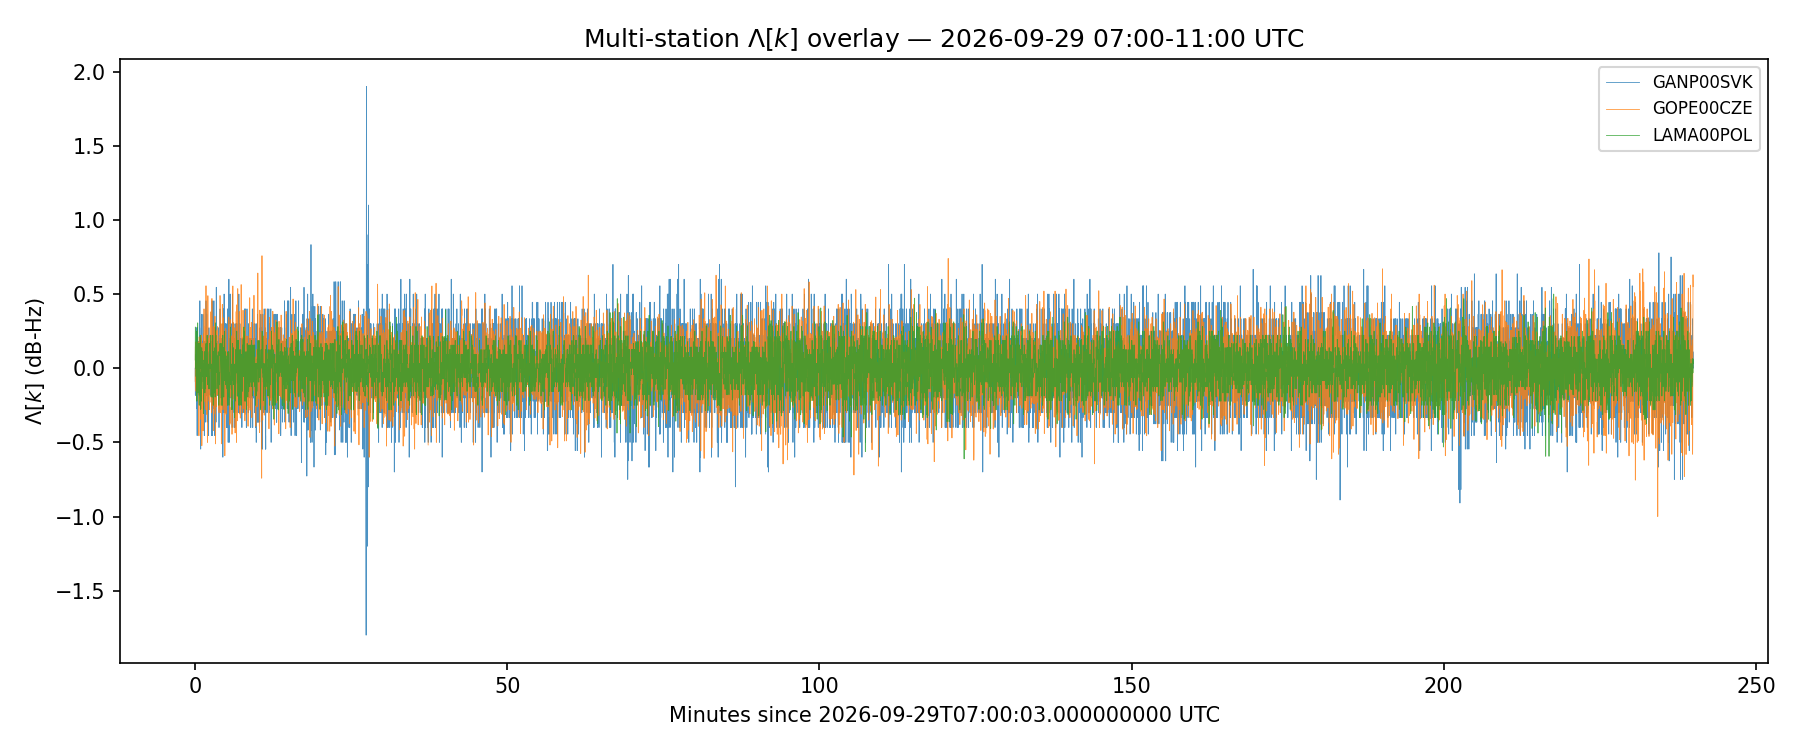
Across all seven stations, the same picture holds at different noise levels. GANP in Slovakia ran the noisiest, at 0.219 dB-Hz standard deviation, and produced the single largest individual spike we recorded anywhere in the dataset.
| Station | Country | Noise floor (σ, dB-Hz) | 5σ crossings | 6σ crossings |
|---|---|---|---|---|
| ONSA (Onsala) | Sweden | 0.125 | 11 | 2 |
| GANP (Ganovce) | Slovakia | 0.219 | 4 | 2 |
| GOPE (Pecny) | Czechia | 0.187 | 1 | 0 |
| WTZR (Wettzell) | Germany | 0.152 | 0 | 0 |
| METG (Metsähovi) | Finland | 0.128 | 0 | 0 |
| MAR6 (Mårtsbo) | Sweden | 0.124 | 0 | 0 |
| LAMA (Lamkówko) | Poland | 0.124 | 0 | 0 |
Totals: 16 isolated single-station crossings at 5σ, collapsing to 4 at 6σ. That collapse is itself a useful, honest data point for anyone tuning a detector like this: loosening the threshold by one sigma roughly quadrupled our false-alarm count, with zero of either set corresponding to a real multi-station event.
The one near-miss, and why it does not count
Twenty-eight station-hours of real-world RF noise produced exactly one coincidence worth walking through, because a credible post shows you the borderline case, not just the clean ones. At 07:27:38 UTC, ONSA crossed its 5σ threshold at +0.656 dB-Hz. Two seconds later, at 07:27:40 UTC, GANP crossed its own 5σ threshold at −1.2 dB-Hz. Two stations, five seconds apart, both flagged: on paper, exactly the shape of a candidate multi-station event.
It is not one, for two reasons the paper's own spatial-simultaneity check is built to catch. First, the sign is wrong: a real wide-area interference source depresses CNR at every station it reaches, it does not raise it at one and lower it at another. Second, the magnitude does not match: ONSA's crossing barely cleared its threshold while GANP's was roughly double the size of its own. At the stricter 6σ threshold, ONSA's 07:27:38 reading no longer qualifies at all, and the coincidence disappears entirely. That GANP spike, incidentally, is also a clean illustration of a known artifact of this method: a true instantaneous step in one station's CNR shows up in Λ[k] as a matched positive-then-negative pair exactly L seconds apart, here +1.9 dB-Hz at 07:27:26 followed by −1.8 dB-Hz at 07:27:29. That pairing is diagnostic of a real, local event at GANP's receiver or antenna. It staying confined to GANP alone, with nothing echoed at GOPE or LAMA 300 to 600 km away, is exactly what rules out a shared physical cause.
What this does not prove
Honest limits, because a number without its caveats is marketing.
- One window, one weekday. A null result across four hours says nothing about other days or times. The cited paper's own 7-year, 165-station dataset flagged interference on a minority of station-days, so a quiet Tuesday afternoon is an expected outcome, not evidence the Baltic theatre is quiet in general.
- This method suits wide-area events, not a single local jammer. The standard IGS archive is built for synchronized, multi-second-plus phenomena, the kind a space-based or very powerful source produces. The Baltic ground-jammer localizations reported by regional researchers used purpose-built, dense TDOA sensor arrays, a different instrument entirely. This pipeline will not hand you the coordinates of a jammer on a ship.
- Seven stations is a demonstration, not a census. We make no claim about regional jamming prevalence from this sample. It shows the method works end to end on real data and shows what an honest baseline looks like.
- Threshold choice is a real tradeoff. Our own data shows it directly: 16 flagged epochs at 5σ fall to 4 at 6σ, all of them false alarms either way in our window. Anyone deploying this needs to tune that threshold against their own station's noise floor.
How to run this yourself
Everything here is available to anyone for free. Pick a set of geographically dispersed IGS high-rate stations from the current network list at network.igs.org. Pull 15-minute RINEX v3 blocks via anonymous FTP-SSL from CDDIS's public archive, no account required. Decompress and parse with open-source tooling such as georinex, extracting the CNR observable for your constellation and frequency of interest. Compute Λ[k] exactly as described above, fit your own stations' noise floors, and, critically, never call a single-station crossing a detection on its own. The spatial-simultaneity check across dispersed stations is what turns a receiver hiccup into a defensible claim, and it is also the step that correctly threw out our one near-miss.
Why this matters
The value of a method like this is that it reads ground truth at the signal layer, from infrastructure nobody has to trust a vendor's dashboard for. gpsjam.org and similar tools do valuable work inferring interference from how aircraft and ships behave downstream. This approach reads the cause more directly, in data that a global network of geodetic-grade receivers already publishes for free, hour by hour, and has for decades. That combination, a real academic detection method, public data with no access barrier beyond a free FTP login, and a fully reproducible pipeline, is rare in a space otherwise dominated by vendor sales pages and classified feeds. We ran it honestly, including the result we did not expect to be the most useful part: a clean baseline, with real false-alarm numbers attached, is exactly what anyone deploying this method needs to know before they trust its first alert.